- Home
- Tutorials
- Events
- Certification Courses
- Contact Us
-
-
On Campus
Wallis Annenberg Hall (ANN) 301
-
Email
Tech inquiries: asctech@usc.edu
General information: annenbergdl@usc.edu
-
Hours
Monday-Thursday: 9am-10pm
Friday: 9am-5pm
-
-

- This event has passed.
Data Analysis with Excel: Charts and Tables
September 23, 2024 @ 4:00 pm - 6:00 pm

Microsoft Excel is the industry standard spreadsheet editor and is one of the most important tools to learn if you want to do anything data-related with your career.
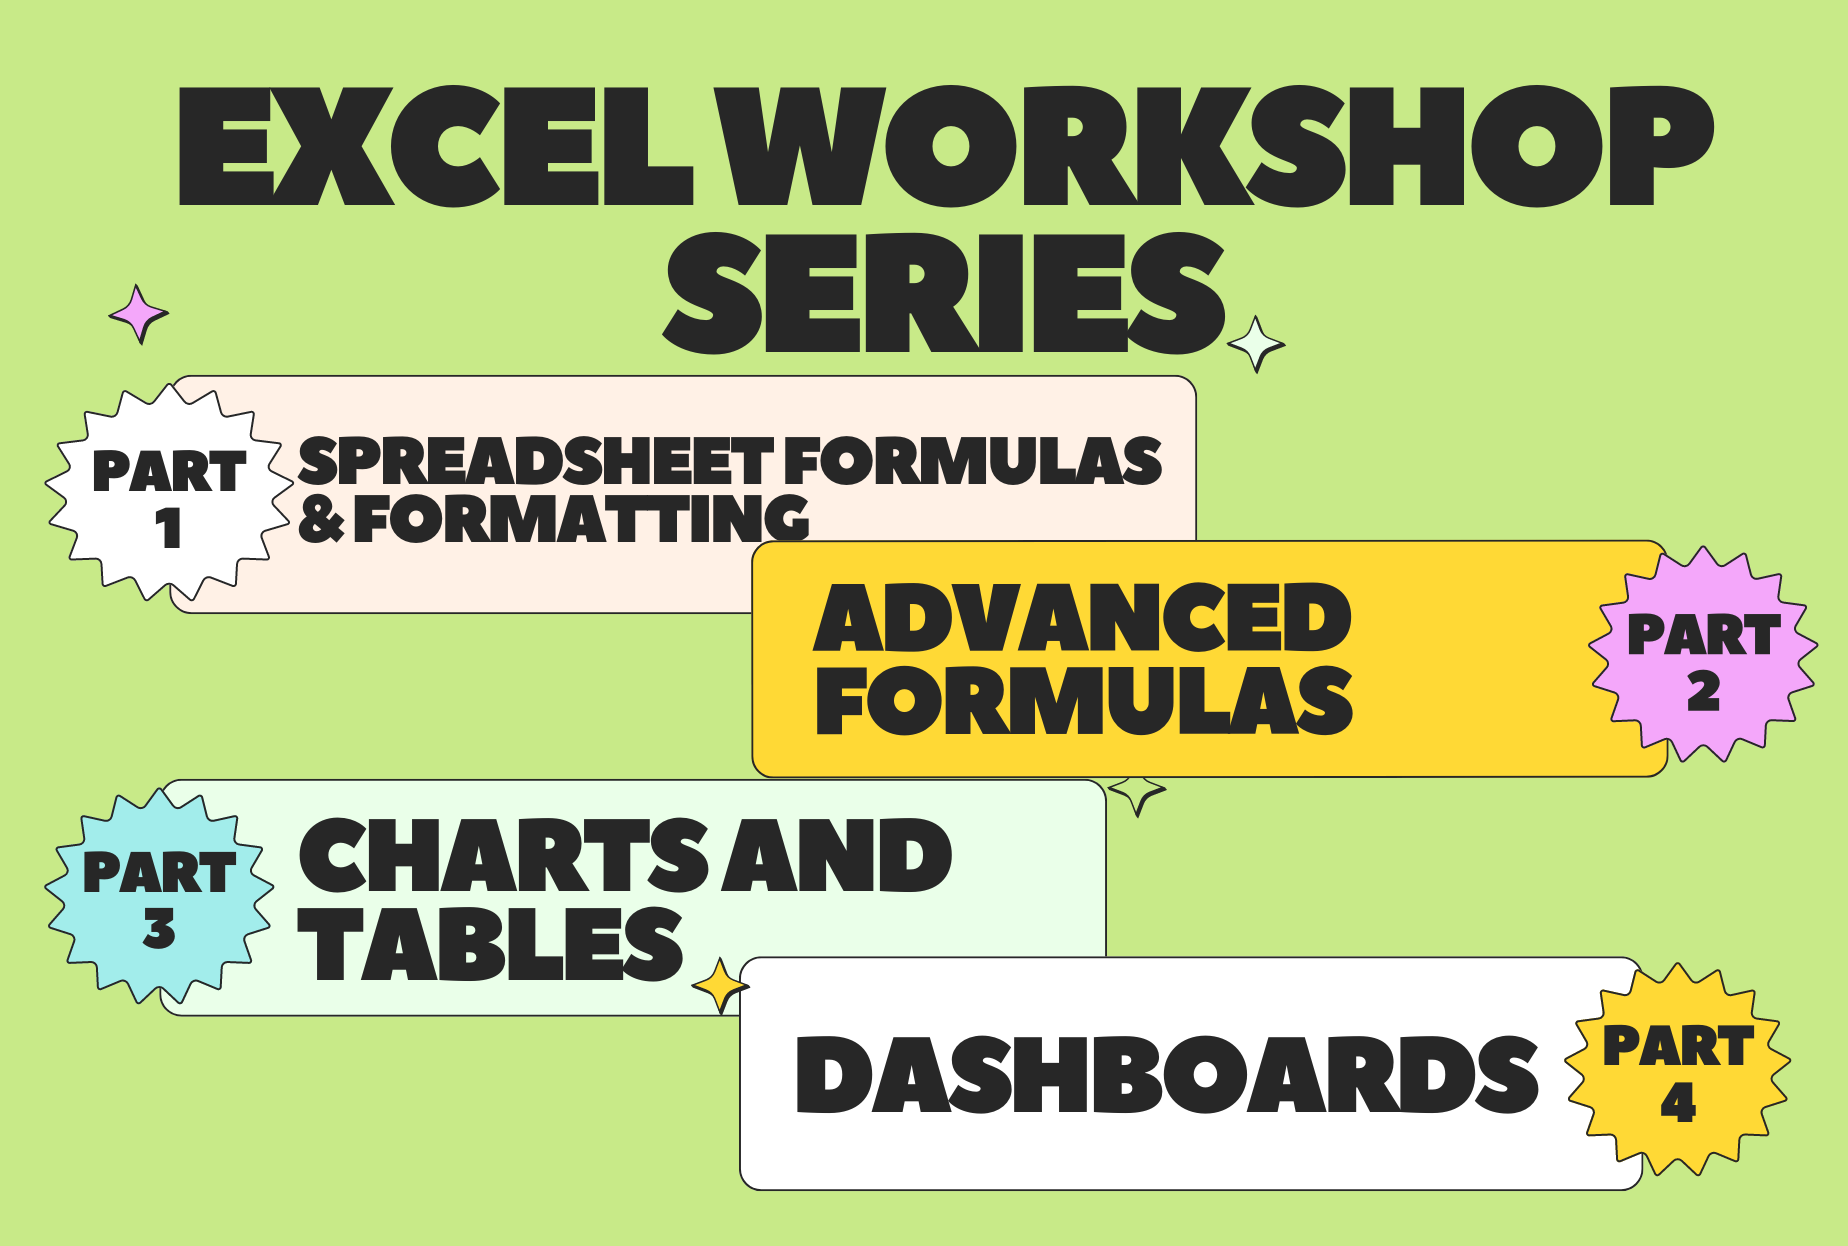
This project-based, four-part workshop series will give you an introduction to Excel and build the foundations to showcase solid data analytics skills. By the end of the series, you’ll have a dashboard you can include in a portfolio to impress employers.
The third workshop, Charts and Tables, introduces how to organize data and turn it into visualizations.
RSVP: bit.ly/f24workshops


